Report Examples: RCM Charts
Report Name |
Sample Report |
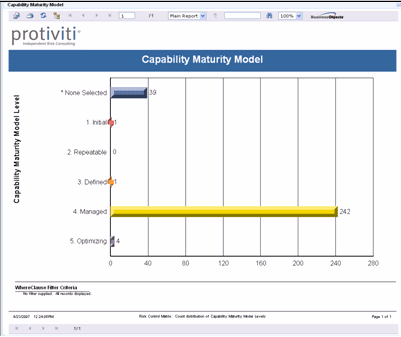
Capability Maturity Model Bar chart showing total counts of Capability Maturity Values in the system |
|
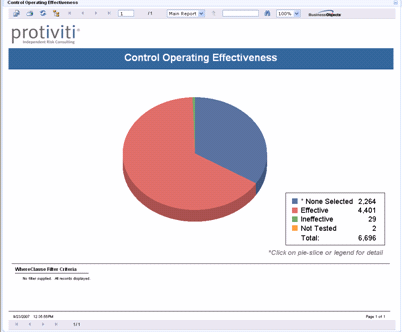
Control Operating Effectiveness Pie chart showing total counts of Control Operating Effectiveness in the system. |
|
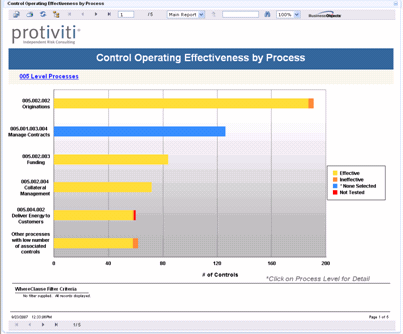
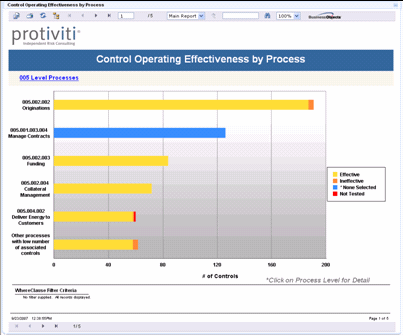
Control Operating Effectiveness by Process Bar charts displaying composition of operating effectiveness evaluations by process. |
|
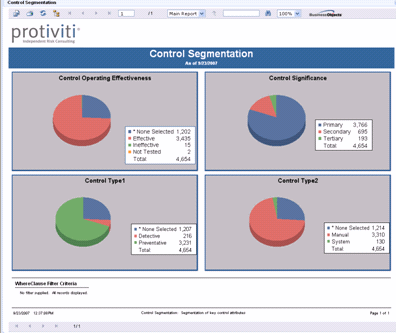
Control Segmentation Pie chart showing total counts of all Control Type Values in the system. |
|
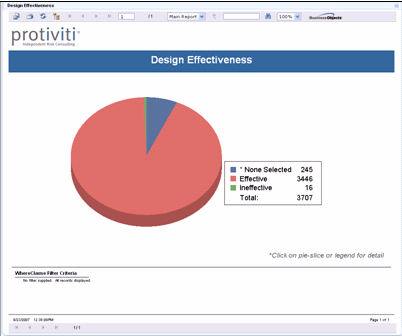
Design Effectiveness Pie chart showing total counts of Risk Design Effectiveness in the system. |
|
Design Effectiveness by Process Bar charts displaying composition of design evaluations by process. |
|
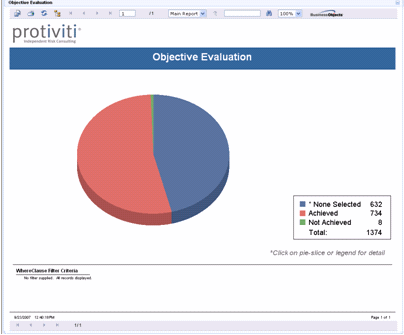
Objective Evaluation Pie chart showing total counts of objective evaluations in the system. |
|
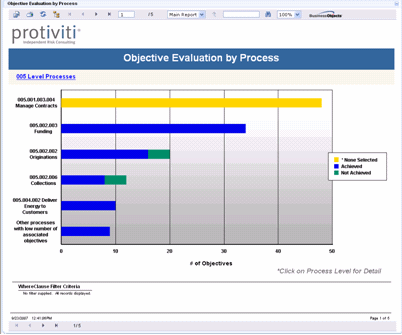
Objective Evaluation by Process Bar charts displaying composition of objective evaluations by process. |
|
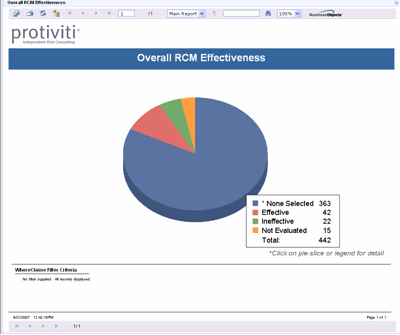
Overall RCM Effectiveness Pie chart showing process effectiveness of all risk control matrices in the system. |
|
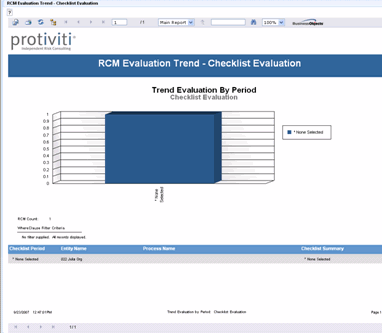
RCM Evaluation Trend - Checklist Evaluation Historic checklist evaluation bar chart and supporting detail
|
|
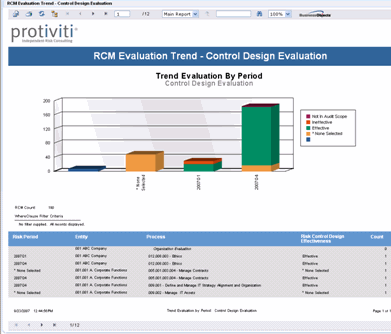
RCM Evaluation Trend - Control Design Evaluation Historic control design bar chart and supporting detail
|
|
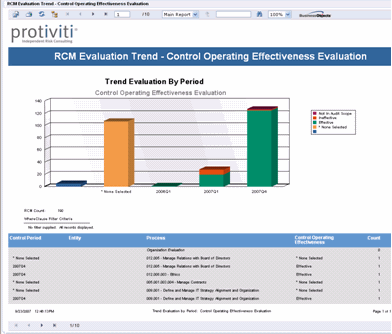
RCM Evaluation Trend - Control Operating Effectiveness Evaluation Historic control operating effectiveness evaluation bar chart and supporting detail
|
|
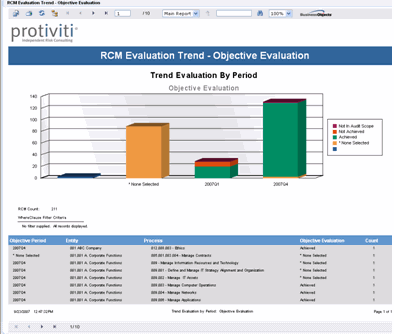
RCM Evaluation Trend - Objective Evaluation Historic objective evaluation bar chart and supporting detail
|
|
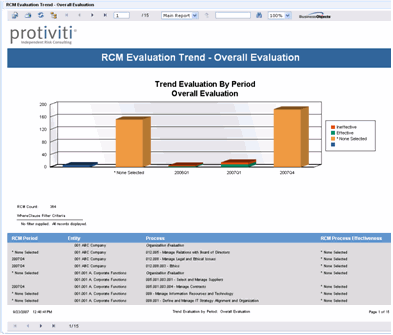
RCM Evaluation Trend - Overall Evaluation Historic overall evaluation bar chart and supporting detail
|
|
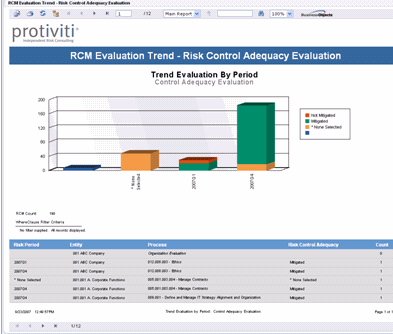
RCM Evaluation Trend - Risk Control Adequacy Evaluation Historic risk control adequacy evaluation bar chart and supporting detail
|
|
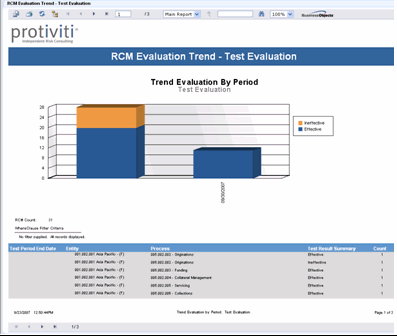
RCM Evaluation Trend - Test Evaluation Historic test evaluation bar chart and supporting detail |
|
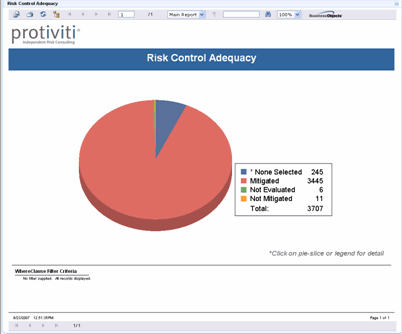
Risk Control Adequacy Pie chart showing total counts of Risk Mitigation in the system. |
|
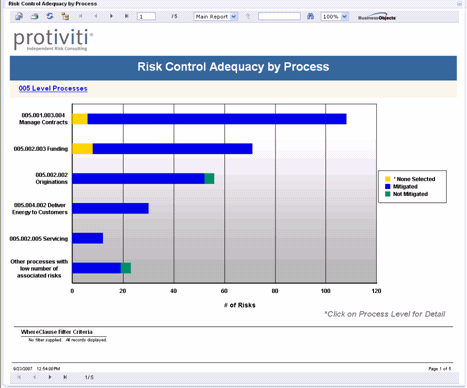
Risk Control Adequacy by Process Bar charts displaying composition of risk evaluations by process. |
|
